
What do the companies in these three groups have in common?
Group A: American Motors, Brown Shoe, Studebaker, Collins Radio, Detroit Steel, Zenith Electronics, and National Sugar Refining.
Group B: Boeing, Campbell Soup Company, Colgate-Palmolive, Deere & Company, General Motors, IBM, Kellogg Company, Procter and Gamble Company, and Whirlpool Corporation.
Group C: Amazon, Facebook, eBay, Home Depot, Microsoft, Google, Netflix, Office Depot, and Target.
All of the companies in Group A were in the Fortune 500 in 1955, but not in 2019.
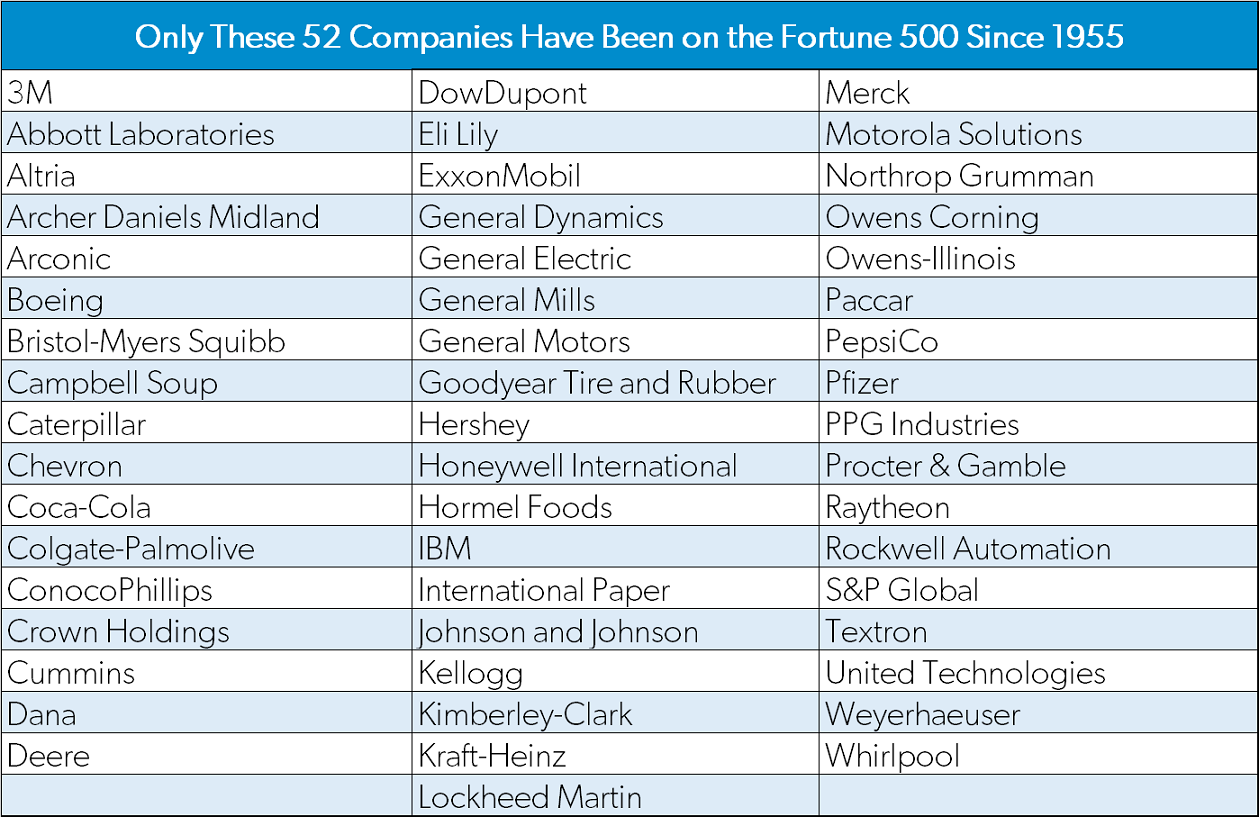
All of the companies in Group B were in the Fortune 500 in both 1955 and 2019 (and have remained on the list every year since it started in 1955).
All of the companies in Group C were in the Fortune 500 in 2019, but not in 1955.
Too Big to Fail?
The list of Fortune 500 companies in 1955 is available here and the list for 2019 was just released last week and is available here (based on sales for the fiscal year ended on or before Jan. 31, 2019).
Comparing the 1955 Fortune 500 companies to the 2019 Fortune 500, there are only 52 companies that appear in both lists and have remained on the list since it started (see graphic above). In other words, only 10.4 percent of the Fortune 500 companies in 1955 have remained on the list during the 64 years since in 2019, and more than 89 percent of the companies from 1955 have either gone bankrupt, merged with (or were acquired by) another firm, or they still exist but have fallen from the top Fortune 500 companies (ranked by total revenues) in one year or more.Market disruption is being driven by the endless pursuit of sales and profits that can only come from serving customers.
For example, Avon Products was in the Fortune 500 last year, but it dropped to No. 501 this year—the cutoff to make the Fortune 500 this year was $5.575 billion in sales, and Avon’s sales were $5.571 billion. Many of the companies on the list in 1955 are unrecognizable, forgotten companies today (e.g., Armstrong Rubber, Cone Mills, Hines Lumber, Pacific Vegetable Oil, and Riegel Textile).
Economic Lessons
The fact that nearly nine of every 10 Fortune 500 companies in 1955 are gone, merged, reorganized, or contracted demonstrates that there’s been a lot of market disruption, churning, and Schumpeterian creative destruction over the last six decades.
It’s reasonable to assume that when the Fortune 500 list is released 60 years from now in 2079, almost all of today’s Fortune 500 companies will no longer exist as currently configured, having been replaced by new companies in new, emerging industries, and for that we should be extremely thankful.
The constant turnover in the Fortune 500 is a positive sign of the dynamism and innovation that characterizes a vibrant consumer-oriented market economy, and that dynamic turnover is speeding up in today’s hyper-competitive global economy.
According to a 2016 report by Innosight, (“Corporate Longevity: Turbulence Ahead for Large Organizations“) corporations in the S&P 500 Index in 1965 stayed in the index for an average of 33 years. As consumers, we are the ultimate beneficiaries of the creative destruction that drives the dynamism of the market economy.By 1990, average tenure in the S&P 500 had narrowed to 20 years and is now forecast to shrink to 14 years by 2026. At the current churn rate, about half of today’s S&P 500 firms will be replaced over the next 10 years as “we enter a period of heightened volatility for leading companies across a range of industries, with the next ten years shaping up to be the most potentially turbulent in modern history” according to Innosight.
Another economic lesson to be learned from the creative destruction that results in the constant churning of Fortune 500 (and S&P 500) companies over time is that the process of market disruption is being driven by the endless pursuit of sales and profits that can only come from serving customers with low prices, high-quality products and services, and great customer service.
If we think of a company’s annual sales revenues as the number of “dollar votes” it gets every year from providing goods and services to consumers, we can then appreciate the fact that the Fortune 500 companies represent the 500 companies that have generated the greatest number dollar votes of confidence from us as consumers—like Walmart (No. 1 this year for the seventh straight year with more than $500 billion in “dollar votes” again for 2019—the second time the sales of any Fortune 500 company has exceeded the $500 billion mark), Exxon Mobil (No. 2 at $290 billion), Apple (No. 3 at $266 billion), Amazon (No. 5 at $233 billion) and CVS Health (No. 8 at $195 billion).
As consumers, we should appreciate the fact that we are the ultimate beneficiaries of the Schumpeterian creative destruction that drives the dynamism of the market economy and results in a constant churning of the firms who are ultimately fighting to attract as many of our dollar votes as possible. The 500 top winners of that competitive battle in any given year are the firms in the Fortune 500, ranked not by their profits, assets or number of employees, but by what is ultimately most important in a market economy:the dollar votes (sales revenues) cast by consumers—the “kings and queens” who rule supreme in the marketplace.
This article was republished with permission from the American Enterprise Institute.

Mark J. Perry
Mark J. Perry is a scholar at the American Enterprise Institute and a professor of economics and finance at the University of Michigan’s Flint campus.